Sunday, March 29, 2015

NOTES (3/24/15) - Countercyclical Fiscal Policies

Fighting A Recession
  • Policy Name = expansionary
  • Taxes = cut
  • Gov. Spending = increase
  • Budget Result = deficit

  • Aggregate Model:
    • C should = increase
    • G should = increase
    • AD should = increase

  • Money Market: 
    • DM will = increase 
    • i should = increase
    • Ig on Aggregate Model will = decrease

  • Loanable Funds Market: 
    • Budget issue will cause-
      • S-LF = decrease
      • D-LF = increase

Fighting Inflation

  • Policy Name = contractionary
  • Taxes = increase
  • Gov. Spending = decrease
  • Budget Result = surplus

  • Aggregate Model:
    • C should = decrease
    • G should = decrease
    • AD should = decrease

  • Money Market: 
    • DM will = decrease 
    • i should = decrease
    • Ig on Aggregate Model will = increase

  • Loanable Funds Market: 
    • Budget issue will cause-
      • S-LF = increase
      • D-LF = decrease
NOTES (3/23/15) - Loanable Funds Market 
  • market where savers and borrowers exchange funds (Qlf) at the real rate of interest (r%)
  • demand for loanable funds, or borrowings, comes from households, firms, government, and the foreign sector; demand for loanable funds is in fact the supply of bonds
  • supply of loanable funds, or savings, comes from households, firms, goverment, and the foreign sector; supply of loanable funds is also the demand for bonds
Changes In Loanable Funds
  • demand for loanable funds = borrowing (i.e. supplying bonds)
  • more borrowing = more demand for loanable funds (->)
  • less borrowing = less demand for loanable funds (<-)
  • Examples:
    • government deficit spending = more borrowers
    • less investment spending = less borrowing
Changes In Supply of Loanable Funds 
  • supply of loanable funds = savings
  • more savings = more supply of loanable funds (->)
  • less savings = less supply of loanable funds (<-)
  • Examples:
    • government budget surplus = more savings
    • decrease in consumers' MPS = less savings
  • when government does fiscal policy it will effect the loanable funds market
  • change in real interest rate (r%) will affect Gross Private Domestic Investment
Blog Assignment - 3/29/2015

Video One: http://www.youtube.com/watch?
v=YLsrkvHo_HA&feature=results_video&playnext=1&list=PL2CB281D126F65E26
     There are three types of money: commodity money, representative money, and fiat money. Commodity money is a good that serves as money, but can also serve another purpose, like cows. Representative money represents a quantity of precious metal. Fiat money, however, doesn't represent anything, excepts for the government's promise that the currency has value. There are three functions of money: as a medium of exchange, as a store of value, and as a unit of account.

Video Two: http://www.youtube.com/watch?v=gzFdeM6lUno&feature=bf_prev&list=PL2CB281D126F65E26&lf=results_video
     Just like any other supply and demand graph that has a price, the money market graph also needs a price. The price that you pay for money is the interest rate, which is denoted by a lowercase i that will label the y-axis. The horizontal graph will be labeled as the quantity of money (QM). In the money market graph, the demand for money (DM) is downward sloping, because the quantity of money demanded is low when the price is high. The supply of money (SM), however, is vertical, because it does not vary based on the interest rate.

Video Three: http://www.youtube.com/watch?v=XJFrPI8lLzQ&feature=bf_next&list=PL2CB281D126F65E26&lf=results_video
     The Fed has three tools of monetary policy, two of which are expansionary policy and contractionary policy. The expansionary policy is also known as easy money, and the contractionary policy is also known as tight money. The first thing the Fed can change using these policies is the reserve requirement, which is the percentage of the bank's total deposits that they must hang on to, either as vault cash or on reserves at a Fed branch. Using an expansionary policy, the Fed will decrease the reserve requirement, but will increase it using the contractionary policy.

Video Four: http://www.youtube.com/watch?v=rdM44CC0ELY&feature=bf_next&list=PL2CB281D126F65E26&lf=results_video
     Loanable funds is money that is available in the banking system for people to borrow. The loanable funds graph will have price (as the interest rate) marking the vertical axis, and quantity of loanable funds marking the horizontal axis. The demand for loanable funds slopes downwards and the supply of loanable funds slopes upwards. The supply of loanable funds comes from the amount of money that people have in banks, which means that it is dependent on savings. The more money people saves means more money that the bank has to make loans. 

Video Five: http://www.youtube.com/watch?v=1tUC59pz95I&feature=bf_next&list=PL2CB281D126F65E26&lf=results_video
     Banks create money by making loans. The formula for the money multiplier is one divided by your RR, or your reserve ratio. 
NOTES (3/20/15) - Policy Summary: Countercyclical Options

Expansionary Policy (Recession)
  • "full employment" economy will have:
    • 1. annual unemployment rate of 4-5%
    • 2. annual inflation rate of 2-3%
  • if economy goes into recession:
    • 3. real GDP will decrease for at least six months
    • 4. unemployment rate will go to at least 6% or more
    • 5. inflation rate will go to 2% or less
  • if Congress enacts Keynesian Fiscal Policies to slow/stop recession:
    • 6. policy will try to improve C or G (parts of AD)
    • 7. Congress will cut federal taxes
    • 8. Congress will increase job and spending programs
    • 9. federal budget will probably create a deficit
    • 10. due to changes in Money Demand, interest rate will increase
  • if Federal Reserve employs Monetary Fiscal Policy to slow/stop recession:
    • 11. policy will target improvement in Ig (part of AD)
    • 12. Fed will target a lower federal fund rate
    • 13. Fed can lower the discount rate
    • 14. Fed can buy bonds (OMO) 
    • 15.Fed can (theoretically) lower reserve requirement
    • 16.Fed policies will lower the interest rates through changes in the Money Supply
    • 17. these options increase Ig
Contractionary Policy (Inflation)
  • if economy suffers from too much demand-pull inflation, then:
    • 18. unemployment rate will go to 4% or less
    • 19. inflation rate will go to 4% or more
  • if Congress enacts Keynesian Fiscal Policies to slow/stop recession:
    • 20. policy will try to decrease C or G (parts of AD)
    • 21. Congress will raise federal raise taxes
    • 22. Congress will decrease job and spending programs
    • 23. federal budget will probably create a surplus
    • 24. due to changes in Money Demand, interest rates will decrease
  • if Federal Reserve employs Monetary Fiscal Policy to slow/stop recession:
    • 25. policy will target decreases in Ig (part of AD)
    • 26. Fed will target a increase federal fund rate
    • 27. Fed can increase the discount rate
    • 28. Fed can sell bonds (OMO) 
    • 29.Fed can (theoretically) raise reserve requirement
    • 30.Fed policies will increase the interest rates through changes in the Money Supply
    • 31. these options decrease Ig


Tuesday, March 3, 2015

Notes (2/12/15) - AGGREGATE SUPPLY
  • The level of real GDP (GDPR) that firms will produce at each price level (PL)
  • Long Run v. Short Run
    • Long Run: time where input prices are flexible and adjust to change in price level
      • level GDP supplied is independent of the price level
    • Short Run: time where input prices are sticky and don't adjust to change in price level
      • level of GDP supplied is directly related to price level
Long Run Aggregate Supple (LRAS)
  • marks level of full employment in the economy (analogous to PPC)
  • because input is completely flexible in the long run, changes in price level do not change firms real profits and therefore do not change firms' level of of output
  • LRAS is vertical at the economy's level of full employment
Short Run Aggregate Supply (SRAS)
  • because input prices are sticky in the short-run, the SRAS is upward sloping
Image result for sras graph
  • changes in SRAS
    • increases in SRAS is seen as shift to right
    • decreases in SRAS is seen as shift to left
    • key to understanding shifts is per unit cost of production
      • per-unit cost of production = total input cost / total output
Determinants of SRAS
  • input prices
  • productivity
  • legal institution environment
Input Prices

  • domestic resource prices
    • wages (75% of all business prices)
    • cost of capital
    • raw materials (commodity prices)
  • foreign resource power
    • Strong money = low foreign resource prices
    • Weak money = high foreign resource prices
  • market power
    • monopolies and cartel that control resources and control prices of those resources
    • increase in resource price = SRAS shift left
    • decrease in resource prices = SRAS shift right
Productivity
  • total output/total inputs
  • more productivity = low unit production cost (AS shift right)
  • less productivity = high unit production cost (AS shift left)

Legal Institution Environment

  • Taxes and subsidies
    • taxes ($ to the govt.) on business increase per-unit production cost (AS shift left)
    • subsidies ($ from the govt.) to business reduce per-unit production cost (AS shift right)
  • Government regulation
    • government regulation creates a cost of compliance (AS shift left)
    • deregulation reduces compliance cost (AS shift right)
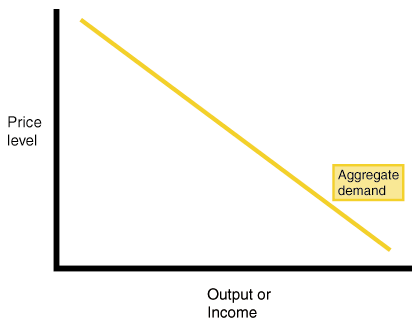


Notes (2/11/15) - AGGREGATE DEMAND
  • shows the amount of real GDP that the private, public, and foreign sectors collectively desire to purchase at each possible price level
  • the relationship between the price level and the level of real GDP is inverse
  • Three reasons AD is downward sloping:
    • (1) Real-balance effects
      • when price-level is high households and businesses cannot afford to purchase as much output
      • when price-level is low households and businesses can afford to purchase more output
    • (2) Interest-rate effects
      • higher price-level increases the interest rate which tends to discourage investment
      • lower price-level decreases the interest rate which tends to encourage investment
    • (3) Foreign-purchase effect
      • higher price-level increases the demand for relatively cheaper imports
      • lower price-level increases the foreign demand for relatively cheaper U.S. exports
Shifts In AD
  • two parts to a shift in AD:
    • (1) change in C, Ig, G, and/or Xn
    • (2) multiplier effect that produces a greater change than the original change in the four components
  • Increases in AD = AD shifts right
  • Decreases in AD = AD shifts left
  • Increase:

  • Decrease: 
Consumption
  • Household spending affected by:
    • consumer wealth
      • more wealth = more spending (AD shifts right)
      • less wealth = less spending (AD shifts left)
    • consumer expectation
      • positive expectation = more spending (AD shifts right)
      • negative expectation = less spending (AD shifts left)
    • household indebtedness
      • less debt = more spending (AD shifts right)
      • more debt = less spending (AD shifts left)
    • taxes
      • less taxes = more spending (AD shifts right)
      • more taxes = less spending (AD shifts left)
Gross Private Domestic Investment
  • Investment spending is sensitive to:
    • Real-interest rate
      • lower real interest rate = more investment (AD shifts right)
      • higher real interest rate = less investment (AD shifts left)
    • Expected returns
      • higher expected return = more investment (AD shift right)
      • lower expected return = less investment (AD shifts left)
      • influenced by
        • (1) expectations of future probability
        • (2) technology
        • (3) degree of excess capacity (existing stock of capital)
        • (4) business taxes

Government Spending
  • More government spending (AD shift right)
  • Less government spending (AD shift left)

Net Exports
  • sensitive to:
    • Exchange rate (international value of %)
      • strong $ = more imports & fewer exports (AD shift left)
      • weak $ = less imports &more exports (AD shift right)
    • Relative income
      • strong foreign economies = more exports (AD shift right)
      • weal foreign economies = less exports (AD shift left)