Sunday, March 29, 2015

NOTES (3/20/15) - Policy Summary: Countercyclical Options

Expansionary Policy (Recession)
  • "full employment" economy will have:
    • 1. annual unemployment rate of 4-5%
    • 2. annual inflation rate of 2-3%
  • if economy goes into recession:
    • 3. real GDP will decrease for at least six months
    • 4. unemployment rate will go to at least 6% or more
    • 5. inflation rate will go to 2% or less
  • if Congress enacts Keynesian Fiscal Policies to slow/stop recession:
    • 6. policy will try to improve C or G (parts of AD)
    • 7. Congress will cut federal taxes
    • 8. Congress will increase job and spending programs
    • 9. federal budget will probably create a deficit
    • 10. due to changes in Money Demand, interest rate will increase
  • if Federal Reserve employs Monetary Fiscal Policy to slow/stop recession:
    • 11. policy will target improvement in Ig (part of AD)
    • 12. Fed will target a lower federal fund rate
    • 13. Fed can lower the discount rate
    • 14. Fed can buy bonds (OMO) 
    • 15.Fed can (theoretically) lower reserve requirement
    • 16.Fed policies will lower the interest rates through changes in the Money Supply
    • 17. these options increase Ig
Contractionary Policy (Inflation)
  • if economy suffers from too much demand-pull inflation, then:
    • 18. unemployment rate will go to 4% or less
    • 19. inflation rate will go to 4% or more
  • if Congress enacts Keynesian Fiscal Policies to slow/stop recession:
    • 20. policy will try to decrease C or G (parts of AD)
    • 21. Congress will raise federal raise taxes
    • 22. Congress will decrease job and spending programs
    • 23. federal budget will probably create a surplus
    • 24. due to changes in Money Demand, interest rates will decrease
  • if Federal Reserve employs Monetary Fiscal Policy to slow/stop recession:
    • 25. policy will target decreases in Ig (part of AD)
    • 26. Fed will target a increase federal fund rate
    • 27. Fed can increase the discount rate
    • 28. Fed can sell bonds (OMO) 
    • 29.Fed can (theoretically) raise reserve requirement
    • 30.Fed policies will increase the interest rates through changes in the Money Supply
    • 31. these options decrease Ig


Tuesday, March 3, 2015

Notes (2/12/15) - AGGREGATE SUPPLY
  • The level of real GDP (GDPR) that firms will produce at each price level (PL)
  • Long Run v. Short Run
    • Long Run: time where input prices are flexible and adjust to change in price level
      • level GDP supplied is independent of the price level
    • Short Run: time where input prices are sticky and don't adjust to change in price level
      • level of GDP supplied is directly related to price level
Long Run Aggregate Supple (LRAS)
  • marks level of full employment in the economy (analogous to PPC)
  • because input is completely flexible in the long run, changes in price level do not change firms real profits and therefore do not change firms' level of of output
  • LRAS is vertical at the economy's level of full employment
Short Run Aggregate Supply (SRAS)
  • because input prices are sticky in the short-run, the SRAS is upward sloping
Image result for sras graph
  • changes in SRAS
    • increases in SRAS is seen as shift to right
    • decreases in SRAS is seen as shift to left
    • key to understanding shifts is per unit cost of production
      • per-unit cost of production = total input cost / total output
Determinants of SRAS
  • input prices
  • productivity
  • legal institution environment
Input Prices

  • domestic resource prices
    • wages (75% of all business prices)
    • cost of capital
    • raw materials (commodity prices)
  • foreign resource power
    • Strong money = low foreign resource prices
    • Weak money = high foreign resource prices
  • market power
    • monopolies and cartel that control resources and control prices of those resources
    • increase in resource price = SRAS shift left
    • decrease in resource prices = SRAS shift right
Productivity
  • total output/total inputs
  • more productivity = low unit production cost (AS shift right)
  • less productivity = high unit production cost (AS shift left)

Legal Institution Environment

  • Taxes and subsidies
    • taxes ($ to the govt.) on business increase per-unit production cost (AS shift left)
    • subsidies ($ from the govt.) to business reduce per-unit production cost (AS shift right)
  • Government regulation
    • government regulation creates a cost of compliance (AS shift left)
    • deregulation reduces compliance cost (AS shift right)


Notes (2/11/15) - AGGREGATE DEMAND
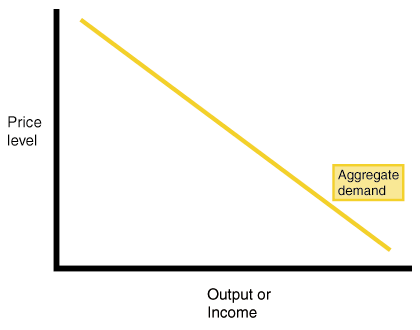
  • shows the amount of real GDP that the private, public, and foreign sectors collectively desire to purchase at each possible price level
  • the relationship between the price level and the level of real GDP is inverse
  • Three reasons AD is downward sloping:
    • (1) Real-balance effects
      • when price-level is high households and businesses cannot afford to purchase as much output
      • when price-level is low households and businesses can afford to purchase more output
    • (2) Interest-rate effects
      • higher price-level increases the interest rate which tends to discourage investment
      • lower price-level decreases the interest rate which tends to encourage investment
    • (3) Foreign-purchase effect
      • higher price-level increases the demand for relatively cheaper imports
      • lower price-level increases the foreign demand for relatively cheaper U.S. exports
Shifts In AD
  • two parts to a shift in AD:
    • (1) change in C, Ig, G, and/or Xn
    • (2) multiplier effect that produces a greater change than the original change in the four components
  • Increases in AD = AD shifts right
  • Decreases in AD = AD shifts left
  • Increase:

  • Decrease: 
Consumption
  • Household spending affected by:
    • consumer wealth
      • more wealth = more spending (AD shifts right)
      • less wealth = less spending (AD shifts left)
    • consumer expectation
      • positive expectation = more spending (AD shifts right)
      • negative expectation = less spending (AD shifts left)
    • household indebtedness
      • less debt = more spending (AD shifts right)
      • more debt = less spending (AD shifts left)
    • taxes
      • less taxes = more spending (AD shifts right)
      • more taxes = less spending (AD shifts left)
Gross Private Domestic Investment
  • Investment spending is sensitive to:
    • Real-interest rate
      • lower real interest rate = more investment (AD shifts right)
      • higher real interest rate = less investment (AD shifts left)
    • Expected returns
      • higher expected return = more investment (AD shift right)
      • lower expected return = less investment (AD shifts left)
      • influenced by
        • (1) expectations of future probability
        • (2) technology
        • (3) degree of excess capacity (existing stock of capital)
        • (4) business taxes

Government Spending
  • More government spending (AD shift right)
  • Less government spending (AD shift left)

Net Exports
  • sensitive to:
    • Exchange rate (international value of %)
      • strong $ = more imports & fewer exports (AD shift left)
      • weak $ = less imports &more exports (AD shift right)
    • Relative income
      • strong foreign economies = more exports (AD shift right)
      • weal foreign economies = less exports (AD shift left)

Tuesday, February 10, 2015

Notes (2/3/15)- Unemployment

Unemployment: percentage of people who do not have jobs but are in the labor force
  • Labor Force
    • number of people in a country that are classified as either employed or unemployed
      • Unemployment rate: # of unemployed / # of unemployed + # employed * 100
  • Not In Labor Force
    1. Kids
    2. Retired people
    3. Military personal
    4. Mentally insane
    5. Incarcerated
    6. Stay at home parents
    7. Full time students
    8. Discouraged workers
  • Full Employment
    • occurs when there is no cyclical unemployment present in the economy
    • natural rate of unemployment (NRU): another name for full employment
    • 4% to 5%
  • Why is unemployment good?
    1. because there is less pressure to raise wages
    2. more workers are available for future expansions
  • Why is unemployment bad?
    1. not enough consumption
    2. too much poverty
    3. too much government assistance needed
  • Okun's Law
    • for every 1% of unemployment above the NRU causes a 2% decline in real GDP 
Notes (2/2/15)- Inflation

  • I. Inflation: rise in general level of prices
    • standard rate is 2%-3%
  • II. Measuring Inflation
    • a. Inflation rate: measures the % increase in the price level over time; key indicator of the economy's health
      • i. deflation: decline in general price level
      • ii. disinflation: when the inflation rate itself declines
    • b. Consumer Price Index (CPI): measures inflation buy tracking the yearly price of a fixed basket of consumer goods & services; in addition, indicates changes in cost of living and price level
  • III. Solving Inflation Problems
    • a. Finding inflation rate using market basket data
      • current year market basket value - base year market basket value / base year market basket value * 100
    • b. Finding inflation rate using price indexes
      • current year price index - base year price index / base year price index * 100
    • c. Estimating inflation using the Rule of 70
      • used to calculate # of years it will take the price level to double at any given rate of inflation
      • years needed to double inflation = 70 / annual inflation rate
    • d. Determining real wages
      • real wages = nominal wages / price level * 100
    • e. Finding real interest rates
      • real interest rate = nominal interest - inflation premium 
        • i. Real interest rate: cost of borrowing and lending adjusted for expected in inflation rate
        • Nominal interest rate: unadjusted cost of borrowing or lending money
  • IV. Cause of Inflation
    • a.Demand-pull inflation: cause by an excess of demand over output that pulls prices upward
    • Cost-pull inflation: caused by a rise in per unit production cost due to increasing resource cost
  • V. Effects of Inflation
    • Anticipated: anticipated inflation
    • Unanticipated inflation: not expecting inflation


Sunday, February 8, 2015

Notes (1/27/15)- GDP/GNP
  • GDP- total dollar value of all goods & services produced within a country's borders within a given year
  • GNP- total value of all final goods and services produced by Americans in a year
  • Included in GDP:
    • C+Ig+G+Xn
      • C:consumption
        • 67% of economy
        • has to be final good or service
      • Ig: gross private domestic investment
        • factory equipment maintenance
        • new factory equipment
        • construction of housing
        • unsold inventories of products built in a year
      • G: government spending
        • military spending
        • education
      • Xn: net exports
        • exports-imports
  • Excluded from GDP:
    • (1) Non-market activities
      • volunteering
      • family work
      • illegal drugs
    • (2) Intermediate goods
      • goods/services that are purchased for resale or for further processing
      • trying to avoid double or multiple counting
      • things that go into making something
    • (3) Used or second-hand goods
      • not counted because it was counted the first time purchased
    • (4) Financial transactions
      • stocks, bonds, and real estate
    • (5) Gifts or transferred payment
      • private transfer payments produce no output
      • public transfer payments recipients contribute nothing to the current production

Calculating Cost of GDP:
  • Expenditure approach
    • C+Ig+G+Xn=GDp
  • Income approach- add up all the income earned by households and firms in a single year
    • Wages+Rent+Interest+Profit+Statistical Adjustments

Budget Formula: government purchases of goods & services + government transfer payments - government tax and fee collections
                   -if # is positive = deficit
                   -if # is negative = surplus

Trade Formula: exports - imports

GNP Formula: GDP + net foreign factor payment

NNP Formula: GNP - depreciation

NDP Formula: GNP - depreciation  

National Income Formula: (1) GDP - indirect business taxes - depreciation - net foreign factor payments (2) compensation of employees + rental income + interest income + proprietors income + corporate profits

Disposable Personal Income Formula: national income - personal household taxes + government transfer payments


Nominal GDP: the value of output produced in current prices
          -price * quantity
          -an increase from year to year if either output or price increases
Real GDP: the value of output produced in constant or base year prices
          -price * quantity 
          -can increase from year to year only if output increases (output measured by quantity)
          -real GDP only reflects base year prices because of inflation

Price Index
  • measures inflation by tracking changes in the price of a market basket of goods compared to the base year
    • price of market basket of goods in current year / price of market basket of goods in base year * 100
GDP Deflator
  • price index used to adjust from nominal to real GDP
    • in base year, GDP deflator will equal 100                                                                        
    • for years after base year, GDP deflator is greater than 100
    • for years before base year, GDP deflator is less than 100
    • Nominal GDP / Real GDP * 100
Calculating Inflation
  • new GDP deflator-old GDP delfator / old GDP deflator * 100 
Circular Flow Model Notes (1/23/15)- Market Economy 
  • Resource (Factor) Market- land, labor, entrepreneurship
    • firms buy
    • households sell
  • Product Market- product, service
    • firms sell
    • households buy
  • Government 
    • both a consumer & producer in both markets
Example of a market economy: