Sunday, May 17, 2015

SUPPLY SIDE ECONOMICS NOTES (4/7/15)

  • The believe that the AS curve will determine levels of inflation, unemployment, and economic growth
  • To increases economy, the AS curve will have to shift to the right, which will benefit the company first
  • Supply side economists tend to focus on marginal tax rates
    • marginal tax rates - amount paid on the last $ earned or on each additional $ earned
  • Lower taxes are incentives for businesses to invest in our economy and are also incentives for workers to work more and harder, thereby becoming more productive
  • Lower taxes are incentives for people to increase savings and therefore create lower interest rates which will increase business investment
  • Supply side economists support policies that promote GDP growth by arguing that high marginal tax rates along w/ our current system of transfer payments, such as unemployment compensation or welfare programs, provide disincentives to work, invest, innovate, and undertake entrepreneurial ventures 
  • Referred to as Reaganomics
    • lowered marginal tax rates to get US out of recession -> deficit

Laffer Curve 

  • trade off between tax rates and government revenue
  • used to support supply side argument
  • as tax revenue increases from 0, tax revenues increase from 0 to some maximum level and then declines 
  • 3 criticisms of Laffer curve
    • (1) research suggest that the impact of tax rates on incentives to work, to invest, and to save are small
    • (2) tax cuts also increase demand which can fuel inflation and it causes demand to exceed supply
    • (3) where the economy is actually located on the curve is yet to be determined

UNIT SIX: ECONOMIC GROWTH AND PRODUCTIVITY NOTES (4/5/15)

Economic Growth Defined
  • Sustained increase in Real GDP over time
  • Sustained increase in Real GDP per capita over time
Why Grow?

  • Growth leads to greater prosperity for society
  • Lessens the burden of scarcity
  • Increases the general level of well-being
Conditions for Growth
  • Rule of Law
  • Sound Legal and Economic Institutions
  • Economic Freedom
  • Respect for Private Property
  • Political & Economic Stability
  • Low Inflationary Expectations
  • Willingness to sacrifice current consumption in order to grow
  • Saving
  • Trade
Physical Capital
  • Tools, machinery, factories, infrastructure
  • Physical Capital is the product of Investment
  • Investment is sensitive to interest rates and expected rates of return
  • If takes capital to make capital
  • Capital must be maintained
Technology & Productivity
  • Research and development, innovation and invention yield increases in available technology
  • More technology in the hands of workers increases productivity
  • Productivity is output per worker
  • More Productivity = Economic Growth
Human Capital
  • People are a country’s most important resource. Therefore human capital must be developed
  • Education
  • Economic Freedom
  • The right to acquire private property
  • Incentives
  • Clean Water
  • Stable Food Supply
  • Access to technology
Hindrances to Growth
  • Economic and Political Instability
    • high inflationary expectation
  • Absence of the rule of law
  • Diminished Private Property Rights
  • Negative Incentives
    • the welfare state
  • Lack of Savings
  • Excess current consumption
  • Failure to maintain existing capital
  • Crowding Out of Investment
    • government deficits & debt increasing long term interest rates
  • Increased income inequality -> Populist policies
  • Restrictions on Free International Trade
ABSOLUTE ADVANTAGE VS COMPARATIVE ADVANTAGE NOTES (4/29/15)

Absolute Advantage 

  • Individual: exists when a person can produce more of a certain good/service than someone else in the same amount of time
  • National: exists when a country can produce more of a good/service than another country can in the same time period

Comparative Advantage 

  • Individual/National: exists when an individual or nation can produce a good/service at a lower opportunity cost than can another individual or nation
  • Input Problems
    • where the country who can produce a set amount of something by using the least amount of resources, land, or time has the absolute advantage
    • chosen item / forgone item
  • Output Problems
    • who can produce the problem the best
    • what is given up / what is produced
PURCHASING POWER PARITY NOTES

  • When the currency rates are set by international markets, changes will be based on the actual purchasing power of the currencies
    • Ex.: If the US dollar to the European euro rate is 1.5 to 1, then each $1.50 will buy 1 euro. However, if an item in the US costs $1.50 and then costs more or less than 1 euro, the parity is lost. Markets will adjust quickly in floating rate or pressure for change will occur in fixed rates
Why Do We Exchange Currencies?

  1. To sell export and buy imports
  2. To invest in another country's stocks and bonds
  3. To build stores or factories in other markets
  4. To speculate on currency values
  5. To hold currencies in bank accounts for future exports, imports, and business loans
  6. To control excessive imbalances


FOREIGN EXCHANGE MARKETS NOTES (4/21/15)

  • Buying and selling of currency
    • Ex.: in order to purchase souvenirs in France, first necessary for Americans to sell (supply) their dollars and buy (demand) Euros
  • Exchange rate (e) is determined in the foreign currency markets
    • Ex.: currency exchange rate is approximately 77 yen to 1 US $
  • Simply put, exchange rate is the price of a currency
  • Do not try to calculate exact exchange rate
Tips
  • Always change the D(emand) on one currency graph, the S(upply) line on the other currency graph
  • Move the lines on the two currency graphs in the same direction (R/L) and you will have the correct answer
  • If D on one graph increases, S on the other graph will also increase
  • If D moves to the left, S will move to the left on the other graph

Changes in Exchange Rates

  • Exchange rates (e) are a function of the supply and demand for currency
    • increase in supply of currency will make it cheaper to buy one unit of that currency
    • decrease in supply of currency will make it more expensive to buy one unit of that currency
    • increase in demand for a currency will make it more expensive to buy one unit of that currency
    • decrease in demand for a currency will make it cheaper to buy one unit of that currency

Appreciation

  • Occurs when the exchange rate of that currency increases
    • Hypothetical: 100 Yen used to buy $1, now 200 Yen buys $1
    • dollar is "stronger" because one buys more Yen than it used to

Depreciation

  • Occurs when the exchange rate of that currency decreases
    • 100 Yen used to buy $1, now 50 Yen buys $1
    • dollar is weaker because it takes fewer Yen to buy $1


UNIT 7: BALANCE OF PAYMENTS NOTES (4/9/15)
  • Measure of money inflows and outflows b/w the U.S and the rest of the world (ROW)
    • inflows -> credits
    • outflows -> debts
  • Divided into three accounts
    • (1) current account
    • (2) capital/financial account
    • (3) official reserves account
Double-Entry Bookkeeping
  • Every transaction in the B.O.P is recorded twice on accordance w/ standard practice
    • Ex.: US manufacturer, John Deere, exports $50 million worth of farm equipment to Ireland
      • credit of $50 million to the current account (-$50 million worth of farm equipment or physical assets)
      • debt of $50 million to the capital/financial account (+$50 million worth of Euros or financial assets)
Current Accounts
  • Balance of Trade/ Net Exports
    • exports of goods/services - imports of goods/services
    • exports create a credit to B.O.P
    • imports create a debt to B.O.P
  • Net Foreign Income
    • income earned by US owned foreign assets - income paid to foreign held US assets
      • Ex.: Interest payments on US owned Brazilian bonds - interest payments on German owned US Treasury bonds
  • Net Transfers (tend to unilateral)
    • foreign aid -> debt to the current account
      • Ex.: Mexican immigrant workers send money to family in Mexico
Capital/Financial Accounts
  • Balance of capital ownership
  • Includes purchases of real (property) and financial (stocks) assets
  • Direct investment in the US is a credit to capital account
    • Ex.: Toyota factory in San Francisco
  • Direct investment by US firms/individuals in a foreign country are debts to the capital account
    • Ex.: Intel factory in San Jose, Costa Rica
  • Purchase of foreign financial assets represents a debt to the capital account 
    • Ex.:Warren Buffet buys stocks in Petrochina
  • Purchase of domestic financial assets by foreigners represents a credit to the capital account
    • Ex.: United Arab Emirates Sovereign Wealth Fund purchases a large stake in NASDAQ
Relationship B/w Current & Capital Account
  • Current account and capital account should zero each other out 
  • If the current account has a negative balance (deficit), than the capital account should have a positive balance (surplus)
Official Reserves
  • Foreign currency holdings of the US Federal Reserve System 
  • When there is a B.O.P surplus the Fed accumulates foreign currency and debts the B.O.P
  • When there is a B.O.P deficit the Fed depletes its reserves of foreign currency and credits the B.O.P
Active vs. Passive Official Reserves
  • US is passive in its use of official reserves; does not seek to manipulate the dollar exchange rate
  • China is active in its use of official reserves; actively buys and sells dollars in order to maintain a steady exchange rate with the US

Sunday, March 29, 2015

NOTES (3/24/15) - Countercyclical Fiscal Policies

Fighting A Recession
  • Policy Name = expansionary
  • Taxes = cut
  • Gov. Spending = increase
  • Budget Result = deficit

  • Aggregate Model:
    • C should = increase
    • G should = increase
    • AD should = increase

  • Money Market: 
    • DM will = increase 
    • i should = increase
    • Ig on Aggregate Model will = decrease

  • Loanable Funds Market: 
    • Budget issue will cause-
      • S-LF = decrease
      • D-LF = increase

Fighting Inflation

  • Policy Name = contractionary
  • Taxes = increase
  • Gov. Spending = decrease
  • Budget Result = surplus

  • Aggregate Model:
    • C should = decrease
    • G should = decrease
    • AD should = decrease

  • Money Market: 
    • DM will = decrease 
    • i should = decrease
    • Ig on Aggregate Model will = increase

  • Loanable Funds Market: 
    • Budget issue will cause-
      • S-LF = increase
      • D-LF = decrease
NOTES (3/23/15) - Loanable Funds Market 
  • market where savers and borrowers exchange funds (Qlf) at the real rate of interest (r%)
  • demand for loanable funds, or borrowings, comes from households, firms, government, and the foreign sector; demand for loanable funds is in fact the supply of bonds
  • supply of loanable funds, or savings, comes from households, firms, goverment, and the foreign sector; supply of loanable funds is also the demand for bonds
Changes In Loanable Funds
  • demand for loanable funds = borrowing (i.e. supplying bonds)
  • more borrowing = more demand for loanable funds (->)
  • less borrowing = less demand for loanable funds (<-)
  • Examples:
    • government deficit spending = more borrowers
    • less investment spending = less borrowing
Changes In Supply of Loanable Funds 
  • supply of loanable funds = savings
  • more savings = more supply of loanable funds (->)
  • less savings = less supply of loanable funds (<-)
  • Examples:
    • government budget surplus = more savings
    • decrease in consumers' MPS = less savings
  • when government does fiscal policy it will effect the loanable funds market
  • change in real interest rate (r%) will affect Gross Private Domestic Investment
Blog Assignment - 3/29/2015

Video One: http://www.youtube.com/watch?
v=YLsrkvHo_HA&feature=results_video&playnext=1&list=PL2CB281D126F65E26
     There are three types of money: commodity money, representative money, and fiat money. Commodity money is a good that serves as money, but can also serve another purpose, like cows. Representative money represents a quantity of precious metal. Fiat money, however, doesn't represent anything, excepts for the government's promise that the currency has value. There are three functions of money: as a medium of exchange, as a store of value, and as a unit of account.

Video Two: http://www.youtube.com/watch?v=gzFdeM6lUno&feature=bf_prev&list=PL2CB281D126F65E26&lf=results_video
     Just like any other supply and demand graph that has a price, the money market graph also needs a price. The price that you pay for money is the interest rate, which is denoted by a lowercase i that will label the y-axis. The horizontal graph will be labeled as the quantity of money (QM). In the money market graph, the demand for money (DM) is downward sloping, because the quantity of money demanded is low when the price is high. The supply of money (SM), however, is vertical, because it does not vary based on the interest rate.

Video Three: http://www.youtube.com/watch?v=XJFrPI8lLzQ&feature=bf_next&list=PL2CB281D126F65E26&lf=results_video
     The Fed has three tools of monetary policy, two of which are expansionary policy and contractionary policy. The expansionary policy is also known as easy money, and the contractionary policy is also known as tight money. The first thing the Fed can change using these policies is the reserve requirement, which is the percentage of the bank's total deposits that they must hang on to, either as vault cash or on reserves at a Fed branch. Using an expansionary policy, the Fed will decrease the reserve requirement, but will increase it using the contractionary policy.

Video Four: http://www.youtube.com/watch?v=rdM44CC0ELY&feature=bf_next&list=PL2CB281D126F65E26&lf=results_video
     Loanable funds is money that is available in the banking system for people to borrow. The loanable funds graph will have price (as the interest rate) marking the vertical axis, and quantity of loanable funds marking the horizontal axis. The demand for loanable funds slopes downwards and the supply of loanable funds slopes upwards. The supply of loanable funds comes from the amount of money that people have in banks, which means that it is dependent on savings. The more money people saves means more money that the bank has to make loans. 

Video Five: http://www.youtube.com/watch?v=1tUC59pz95I&feature=bf_next&list=PL2CB281D126F65E26&lf=results_video
     Banks create money by making loans. The formula for the money multiplier is one divided by your RR, or your reserve ratio. 
NOTES (3/20/15) - Policy Summary: Countercyclical Options

Expansionary Policy (Recession)
  • "full employment" economy will have:
    • 1. annual unemployment rate of 4-5%
    • 2. annual inflation rate of 2-3%
  • if economy goes into recession:
    • 3. real GDP will decrease for at least six months
    • 4. unemployment rate will go to at least 6% or more
    • 5. inflation rate will go to 2% or less
  • if Congress enacts Keynesian Fiscal Policies to slow/stop recession:
    • 6. policy will try to improve C or G (parts of AD)
    • 7. Congress will cut federal taxes
    • 8. Congress will increase job and spending programs
    • 9. federal budget will probably create a deficit
    • 10. due to changes in Money Demand, interest rate will increase
  • if Federal Reserve employs Monetary Fiscal Policy to slow/stop recession:
    • 11. policy will target improvement in Ig (part of AD)
    • 12. Fed will target a lower federal fund rate
    • 13. Fed can lower the discount rate
    • 14. Fed can buy bonds (OMO) 
    • 15.Fed can (theoretically) lower reserve requirement
    • 16.Fed policies will lower the interest rates through changes in the Money Supply
    • 17. these options increase Ig
Contractionary Policy (Inflation)
  • if economy suffers from too much demand-pull inflation, then:
    • 18. unemployment rate will go to 4% or less
    • 19. inflation rate will go to 4% or more
  • if Congress enacts Keynesian Fiscal Policies to slow/stop recession:
    • 20. policy will try to decrease C or G (parts of AD)
    • 21. Congress will raise federal raise taxes
    • 22. Congress will decrease job and spending programs
    • 23. federal budget will probably create a surplus
    • 24. due to changes in Money Demand, interest rates will decrease
  • if Federal Reserve employs Monetary Fiscal Policy to slow/stop recession:
    • 25. policy will target decreases in Ig (part of AD)
    • 26. Fed will target a increase federal fund rate
    • 27. Fed can increase the discount rate
    • 28. Fed can sell bonds (OMO) 
    • 29.Fed can (theoretically) raise reserve requirement
    • 30.Fed policies will increase the interest rates through changes in the Money Supply
    • 31. these options decrease Ig


Tuesday, March 3, 2015

Notes (2/12/15) - AGGREGATE SUPPLY
  • The level of real GDP (GDPR) that firms will produce at each price level (PL)
  • Long Run v. Short Run
    • Long Run: time where input prices are flexible and adjust to change in price level
      • level GDP supplied is independent of the price level
    • Short Run: time where input prices are sticky and don't adjust to change in price level
      • level of GDP supplied is directly related to price level
Long Run Aggregate Supple (LRAS)
  • marks level of full employment in the economy (analogous to PPC)
  • because input is completely flexible in the long run, changes in price level do not change firms real profits and therefore do not change firms' level of of output
  • LRAS is vertical at the economy's level of full employment
Short Run Aggregate Supply (SRAS)
  • because input prices are sticky in the short-run, the SRAS is upward sloping
Image result for sras graph
  • changes in SRAS
    • increases in SRAS is seen as shift to right
    • decreases in SRAS is seen as shift to left
    • key to understanding shifts is per unit cost of production
      • per-unit cost of production = total input cost / total output
Determinants of SRAS
  • input prices
  • productivity
  • legal institution environment
Input Prices

  • domestic resource prices
    • wages (75% of all business prices)
    • cost of capital
    • raw materials (commodity prices)
  • foreign resource power
    • Strong money = low foreign resource prices
    • Weak money = high foreign resource prices
  • market power
    • monopolies and cartel that control resources and control prices of those resources
    • increase in resource price = SRAS shift left
    • decrease in resource prices = SRAS shift right
Productivity
  • total output/total inputs
  • more productivity = low unit production cost (AS shift right)
  • less productivity = high unit production cost (AS shift left)

Legal Institution Environment

  • Taxes and subsidies
    • taxes ($ to the govt.) on business increase per-unit production cost (AS shift left)
    • subsidies ($ from the govt.) to business reduce per-unit production cost (AS shift right)
  • Government regulation
    • government regulation creates a cost of compliance (AS shift left)
    • deregulation reduces compliance cost (AS shift right)


Notes (2/11/15) - AGGREGATE DEMAND
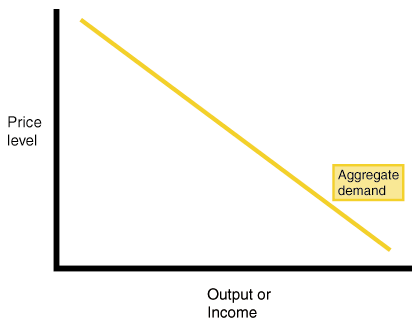
  • shows the amount of real GDP that the private, public, and foreign sectors collectively desire to purchase at each possible price level
  • the relationship between the price level and the level of real GDP is inverse
  • Three reasons AD is downward sloping:
    • (1) Real-balance effects
      • when price-level is high households and businesses cannot afford to purchase as much output
      • when price-level is low households and businesses can afford to purchase more output
    • (2) Interest-rate effects
      • higher price-level increases the interest rate which tends to discourage investment
      • lower price-level decreases the interest rate which tends to encourage investment
    • (3) Foreign-purchase effect
      • higher price-level increases the demand for relatively cheaper imports
      • lower price-level increases the foreign demand for relatively cheaper U.S. exports
Shifts In AD
  • two parts to a shift in AD:
    • (1) change in C, Ig, G, and/or Xn
    • (2) multiplier effect that produces a greater change than the original change in the four components
  • Increases in AD = AD shifts right
  • Decreases in AD = AD shifts left
  • Increase:

  • Decrease: 
Consumption
  • Household spending affected by:
    • consumer wealth
      • more wealth = more spending (AD shifts right)
      • less wealth = less spending (AD shifts left)
    • consumer expectation
      • positive expectation = more spending (AD shifts right)
      • negative expectation = less spending (AD shifts left)
    • household indebtedness
      • less debt = more spending (AD shifts right)
      • more debt = less spending (AD shifts left)
    • taxes
      • less taxes = more spending (AD shifts right)
      • more taxes = less spending (AD shifts left)
Gross Private Domestic Investment
  • Investment spending is sensitive to:
    • Real-interest rate
      • lower real interest rate = more investment (AD shifts right)
      • higher real interest rate = less investment (AD shifts left)
    • Expected returns
      • higher expected return = more investment (AD shift right)
      • lower expected return = less investment (AD shifts left)
      • influenced by
        • (1) expectations of future probability
        • (2) technology
        • (3) degree of excess capacity (existing stock of capital)
        • (4) business taxes

Government Spending
  • More government spending (AD shift right)
  • Less government spending (AD shift left)

Net Exports
  • sensitive to:
    • Exchange rate (international value of %)
      • strong $ = more imports & fewer exports (AD shift left)
      • weak $ = less imports &more exports (AD shift right)
    • Relative income
      • strong foreign economies = more exports (AD shift right)
      • weal foreign economies = less exports (AD shift left)

Tuesday, February 10, 2015

Notes (2/3/15)- Unemployment

Unemployment: percentage of people who do not have jobs but are in the labor force
  • Labor Force
    • number of people in a country that are classified as either employed or unemployed
      • Unemployment rate: # of unemployed / # of unemployed + # employed * 100
  • Not In Labor Force
    1. Kids
    2. Retired people
    3. Military personal
    4. Mentally insane
    5. Incarcerated
    6. Stay at home parents
    7. Full time students
    8. Discouraged workers
  • Full Employment
    • occurs when there is no cyclical unemployment present in the economy
    • natural rate of unemployment (NRU): another name for full employment
    • 4% to 5%
  • Why is unemployment good?
    1. because there is less pressure to raise wages
    2. more workers are available for future expansions
  • Why is unemployment bad?
    1. not enough consumption
    2. too much poverty
    3. too much government assistance needed
  • Okun's Law
    • for every 1% of unemployment above the NRU causes a 2% decline in real GDP 
Notes (2/2/15)- Inflation

  • I. Inflation: rise in general level of prices
    • standard rate is 2%-3%
  • II. Measuring Inflation
    • a. Inflation rate: measures the % increase in the price level over time; key indicator of the economy's health
      • i. deflation: decline in general price level
      • ii. disinflation: when the inflation rate itself declines
    • b. Consumer Price Index (CPI): measures inflation buy tracking the yearly price of a fixed basket of consumer goods & services; in addition, indicates changes in cost of living and price level
  • III. Solving Inflation Problems
    • a. Finding inflation rate using market basket data
      • current year market basket value - base year market basket value / base year market basket value * 100
    • b. Finding inflation rate using price indexes
      • current year price index - base year price index / base year price index * 100
    • c. Estimating inflation using the Rule of 70
      • used to calculate # of years it will take the price level to double at any given rate of inflation
      • years needed to double inflation = 70 / annual inflation rate
    • d. Determining real wages
      • real wages = nominal wages / price level * 100
    • e. Finding real interest rates
      • real interest rate = nominal interest - inflation premium 
        • i. Real interest rate: cost of borrowing and lending adjusted for expected in inflation rate
        • Nominal interest rate: unadjusted cost of borrowing or lending money
  • IV. Cause of Inflation
    • a.Demand-pull inflation: cause by an excess of demand over output that pulls prices upward
    • Cost-pull inflation: caused by a rise in per unit production cost due to increasing resource cost
  • V. Effects of Inflation
    • Anticipated: anticipated inflation
    • Unanticipated inflation: not expecting inflation


Sunday, February 8, 2015

Notes (1/27/15)- GDP/GNP
  • GDP- total dollar value of all goods & services produced within a country's borders within a given year
  • GNP- total value of all final goods and services produced by Americans in a year
  • Included in GDP:
    • C+Ig+G+Xn
      • C:consumption
        • 67% of economy
        • has to be final good or service
      • Ig: gross private domestic investment
        • factory equipment maintenance
        • new factory equipment
        • construction of housing
        • unsold inventories of products built in a year
      • G: government spending
        • military spending
        • education
      • Xn: net exports
        • exports-imports
  • Excluded from GDP:
    • (1) Non-market activities
      • volunteering
      • family work
      • illegal drugs
    • (2) Intermediate goods
      • goods/services that are purchased for resale or for further processing
      • trying to avoid double or multiple counting
      • things that go into making something
    • (3) Used or second-hand goods
      • not counted because it was counted the first time purchased
    • (4) Financial transactions
      • stocks, bonds, and real estate
    • (5) Gifts or transferred payment
      • private transfer payments produce no output
      • public transfer payments recipients contribute nothing to the current production

Calculating Cost of GDP:
  • Expenditure approach
    • C+Ig+G+Xn=GDp
  • Income approach- add up all the income earned by households and firms in a single year
    • Wages+Rent+Interest+Profit+Statistical Adjustments

Budget Formula: government purchases of goods & services + government transfer payments - government tax and fee collections
                   -if # is positive = deficit
                   -if # is negative = surplus

Trade Formula: exports - imports

GNP Formula: GDP + net foreign factor payment

NNP Formula: GNP - depreciation

NDP Formula: GNP - depreciation  

National Income Formula: (1) GDP - indirect business taxes - depreciation - net foreign factor payments (2) compensation of employees + rental income + interest income + proprietors income + corporate profits

Disposable Personal Income Formula: national income - personal household taxes + government transfer payments


Nominal GDP: the value of output produced in current prices
          -price * quantity
          -an increase from year to year if either output or price increases
Real GDP: the value of output produced in constant or base year prices
          -price * quantity 
          -can increase from year to year only if output increases (output measured by quantity)
          -real GDP only reflects base year prices because of inflation

Price Index
  • measures inflation by tracking changes in the price of a market basket of goods compared to the base year
    • price of market basket of goods in current year / price of market basket of goods in base year * 100
GDP Deflator
  • price index used to adjust from nominal to real GDP
    • in base year, GDP deflator will equal 100                                                                        
    • for years after base year, GDP deflator is greater than 100
    • for years before base year, GDP deflator is less than 100
    • Nominal GDP / Real GDP * 100
Calculating Inflation
  • new GDP deflator-old GDP delfator / old GDP deflator * 100 
Circular Flow Model Notes (1/23/15)- Market Economy 
  • Resource (Factor) Market- land, labor, entrepreneurship
    • firms buy
    • households sell
  • Product Market- product, service
    • firms sell
    • households buy
  • Government 
    • both a consumer & producer in both markets
Example of a market economy:

Wednesday, January 21, 2015

NOTES (1/16/15)- SURPLUS & SHORTAGE
  • Surplus: QS > QD
  • Shortage: QD > QS 
  • Equilibrium: point at which supply and demand intersect; resources are used efficiently
  • Disequilibrium: resources are not used efficiently and not intersecting
  • Price Ceiling: government imposed price control on how high a price can be changed for a product/service
    • Ex. rent control
  • Price Floor: government imposed price control on how low someone can charge for a product/service
    • Ex. minimum wage
NOTES (1/14/15)- ELASTICITY
  • Price Elasticity of Demand: tells how drastically buyers will cut back or increase their demands for a good when a price rises or falls
    • (1) Elastic Demand- when demand changes greatly due to a change in price (E>1)
    • (2) Inelastic Demand- demand will not change even if the price changes (E<1)
    • (3) Unit Elastic- perfect ideal situations (E=1)
% Change in Quantity:
            new quantity - old quantity
                       old quantity

% Change in Price:
            new price - old price
                     old price

Price Elasticity of Demand:
      % change in quantity
        %change in price

Monday, January 19, 2015

NOTES (1/12/15)- DEMAND AND SUPPLY 
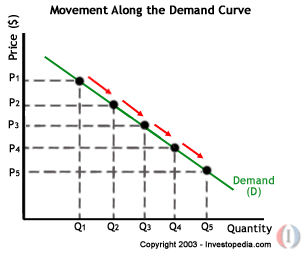
  • Demand: quantities that people are willing and able to buy at various prices
  • The Law of Demand: an inverse relationship between price and quantity demanded
  • Causes of "change in quantity demanded":
    • caused only by a change in price
  • Causes of "change in demand"
    • a change in buyer's taste (advertising)
    • a change in number of buyers (population)
    • a change in income
      • (1) normal goods: goods that buyers buy more of when their income rises
      • (2) inferior goods: goods that buyers buy less of when their income rises
    • a change in price of related goods
      • (1) substitution goods: goods that serve roughly the same purpose to buyers
      • (2) complimentary goods: goods that are often consumed together
    • a change in expectations
Demand Curve:


  • Supply: quantities that producers/sellers are willing and able to produce/sell at various prices
  • The Law of Supply: direct relationship between price and quantity supplied
  • Causes of "change in quantity supplied":
    • change in price
  • Causes of "change in supply":
    • change in weather
    • change in technology 
    • change in cost of production
    • change in taxes or subsidies
    • change in number of sellers
    • change in expectations
Supply Curve: